The FTSE 100, a key indicator of the UK’s largest companies, has been a point of concern for investors lately. The primary culprit? Its lack of exposure to the booming tech sector.
Across the pond, the S&P 500 in the US has been on a tear, fueled by the strong performance of tech giants. These innovative companies have been major drivers of growth, propelling the American index to new highs. In contrast, the FTSE 100, heavily weighted towards traditional sectors like mining, oil, and banks, hasn’t kept pace.
The FTSE’s woes are compounded by anxieties surrounding the global economic slowdown. Concerns about a potential recession are dampening investor enthusiasm for cyclical sectors like mining and oil. These industries typically thrive in periods of strong economic growth, and with fears of a downturn looming, investors are hesitant to jump in.
Furthermore, the prospect of persistently high interest rates throws another wrench into the mix. Central banks are raising rates to combat inflation, which can stifle economic activity and further hinder the performance of these interest-rate sensitive sectors.
While the FTSE 100 offers a healthy dose of stability with its established companies, its lack of diversification, particularly in the red-hot tech arena, is hindering its growth potential. Investors seeking exposure to the current market darlings may find themselves looking elsewhere until the economic outlook brightens and traditional sectors regain their luster.
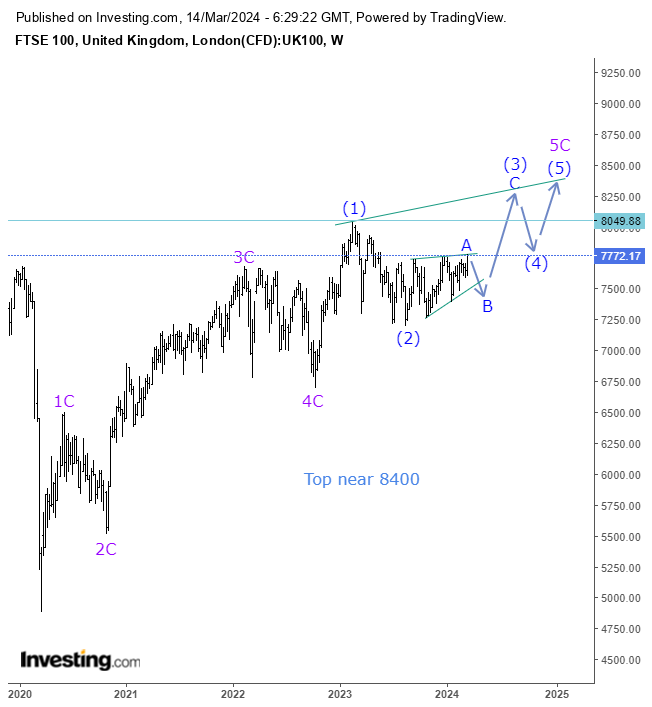
For that reason the FTSE will continue to underperform the S&P 500. Despite this, Elliott wave analysis suggests the FTSE 100 will make a new all-time high. I believe the rally from the low in 2020 is an impulse wave [1C,2C,3C,4C,5C] with an extension in wave 5C. This extension is probably an ending diagonal [(1),(2),(3),(4),(5)] which is a common terminal pattern, terminal because the pattern takes the form of a rising wedge between two converging trendlines. A slowing economy would act as a drag on the advance, this explains why the waves are overlapping in the final move up. This means we are near the top. On the chart you can see we are currently is wave (3), this wave will make a new all-time high. At the end of the five-wave sequence the FTSE 100 could top near 8400.
