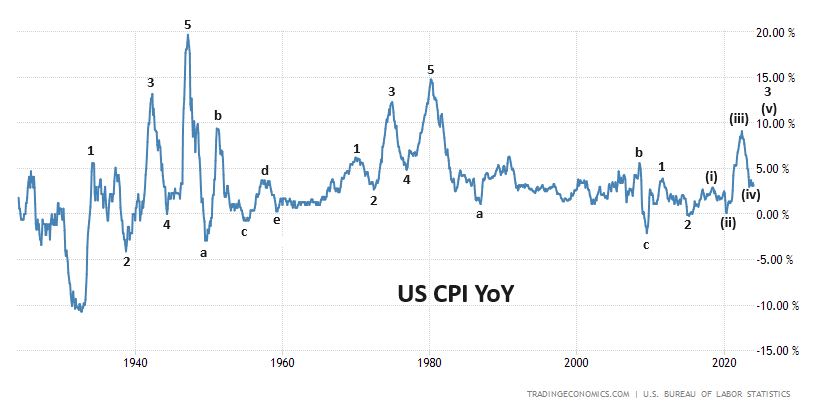
We can see two clear Elliott wave cycles on US CPI since the 1930s. Now we are probably in the third cycle. Elliott wave analysis suggests higher inflation ahead. US CPI data chart going back to the 1930s shows several Elliott wave cycles. The first one occurred in the 1930s and 1940s, during that period inflation rose in five waves [1,2,3,4,5]. The correction that followed was sideways in five waves [a,b,c,d,e]. The second Elliott wave rally occurred during the 1960s and 1970s, once again inflation moved up in five waves but this time the correction was in three waves [a,b,c]. This correction started in the 1980s and lasted until 2009. Wave b was large in time, wave c ended with deflation. If history is any guide, 2009 marked the start of another Elliott wave cycle. Already wave 1 and 2 are complete. The rise since 2020 is wave (iii) inside wave 3. As the pattern repeats itself in different time periods, wave 3 will be in five waves [(i),(ii),(iii),(iv),(v)], wave (iii) peaked at 9% in June 2022. The decline from 9% to 3% is wave (iv), that’s where we are now. Latest CPI number was 3.2%. The next move is wave (v) to 10%-12%. This will complete wave 3. This high will probably be recorded in 2025
A Multifaceted Challenge
Inflation, the rising cost of goods and services, has become a major concern globally. Several factors are contributing to this trend and could keep inflation elevated for some time.
Excess Liquidity: Years of quantitative easing by central banks have indeed increased the money supply, potentially leading to higher demand and ultimately, inflation. This manifests in several ways:
Consumer Spending: Consumers with accumulated savings can continue spending despite rising costs. While higher interest rates might incentivize saving, some may still spend or rely on credit cards (leading to rising consumer debt).
National Debt and Housing: High national debt (like the US’s $34 trillion) often involves deficit spending, which can further fuel inflation. Interestingly, housing markets show resilience – US prices remain near peak levels, and UK prices are rising again. This suggests consumers can handle higher interest rates to some extent.
Asset Prices and Risk Taking: Increased risk appetite is another indicator of excess liquidity.
High-Risk Investments: Demand for volatile assets like Bitcoin suggests some investors have spare cash they can risk. Bitcoin recently made a new all-time high. The rise of cryptocurrencies is linked to rising inflation.
Stock Market Rally: Stock markets in the US and Europe reaching all-time highs could further inflate asset prices if central banks loosen their grip by cutting rates. Unlike thirty years ago, nowadays rising share prices contribute to economic growth and inflation. Market tops occur when inflation is high, market bottoms occur when inflation is low or negative. In some cases like in 2009 the stock market bottom was accompanied by deflation.
Deglobalization: The shift away from globalization towards onshoring production in the West can disrupt established supply chains and potentially lead to higher production costs, ultimately pushing prices up for consumers. The process of de-globalization is underway.
Wage-Price Spiral: Rising inflation often prompts employees to demand higher wages to maintain their purchasing power. However, businesses may pass on these increased costs to consumers through higher prices, creating a vicious cycle where inflation feeds on itself.
Flight to Hard Assets: As inflation erodes the value of cash, investors may turn to hard assets like gold, copper, and oil as a hedge. However, this increased demand for commodities can further push up their prices, exacerbating inflation in another vicious circle. Gold is already at new highs, silver and copper should follow.